
Finance, Computing
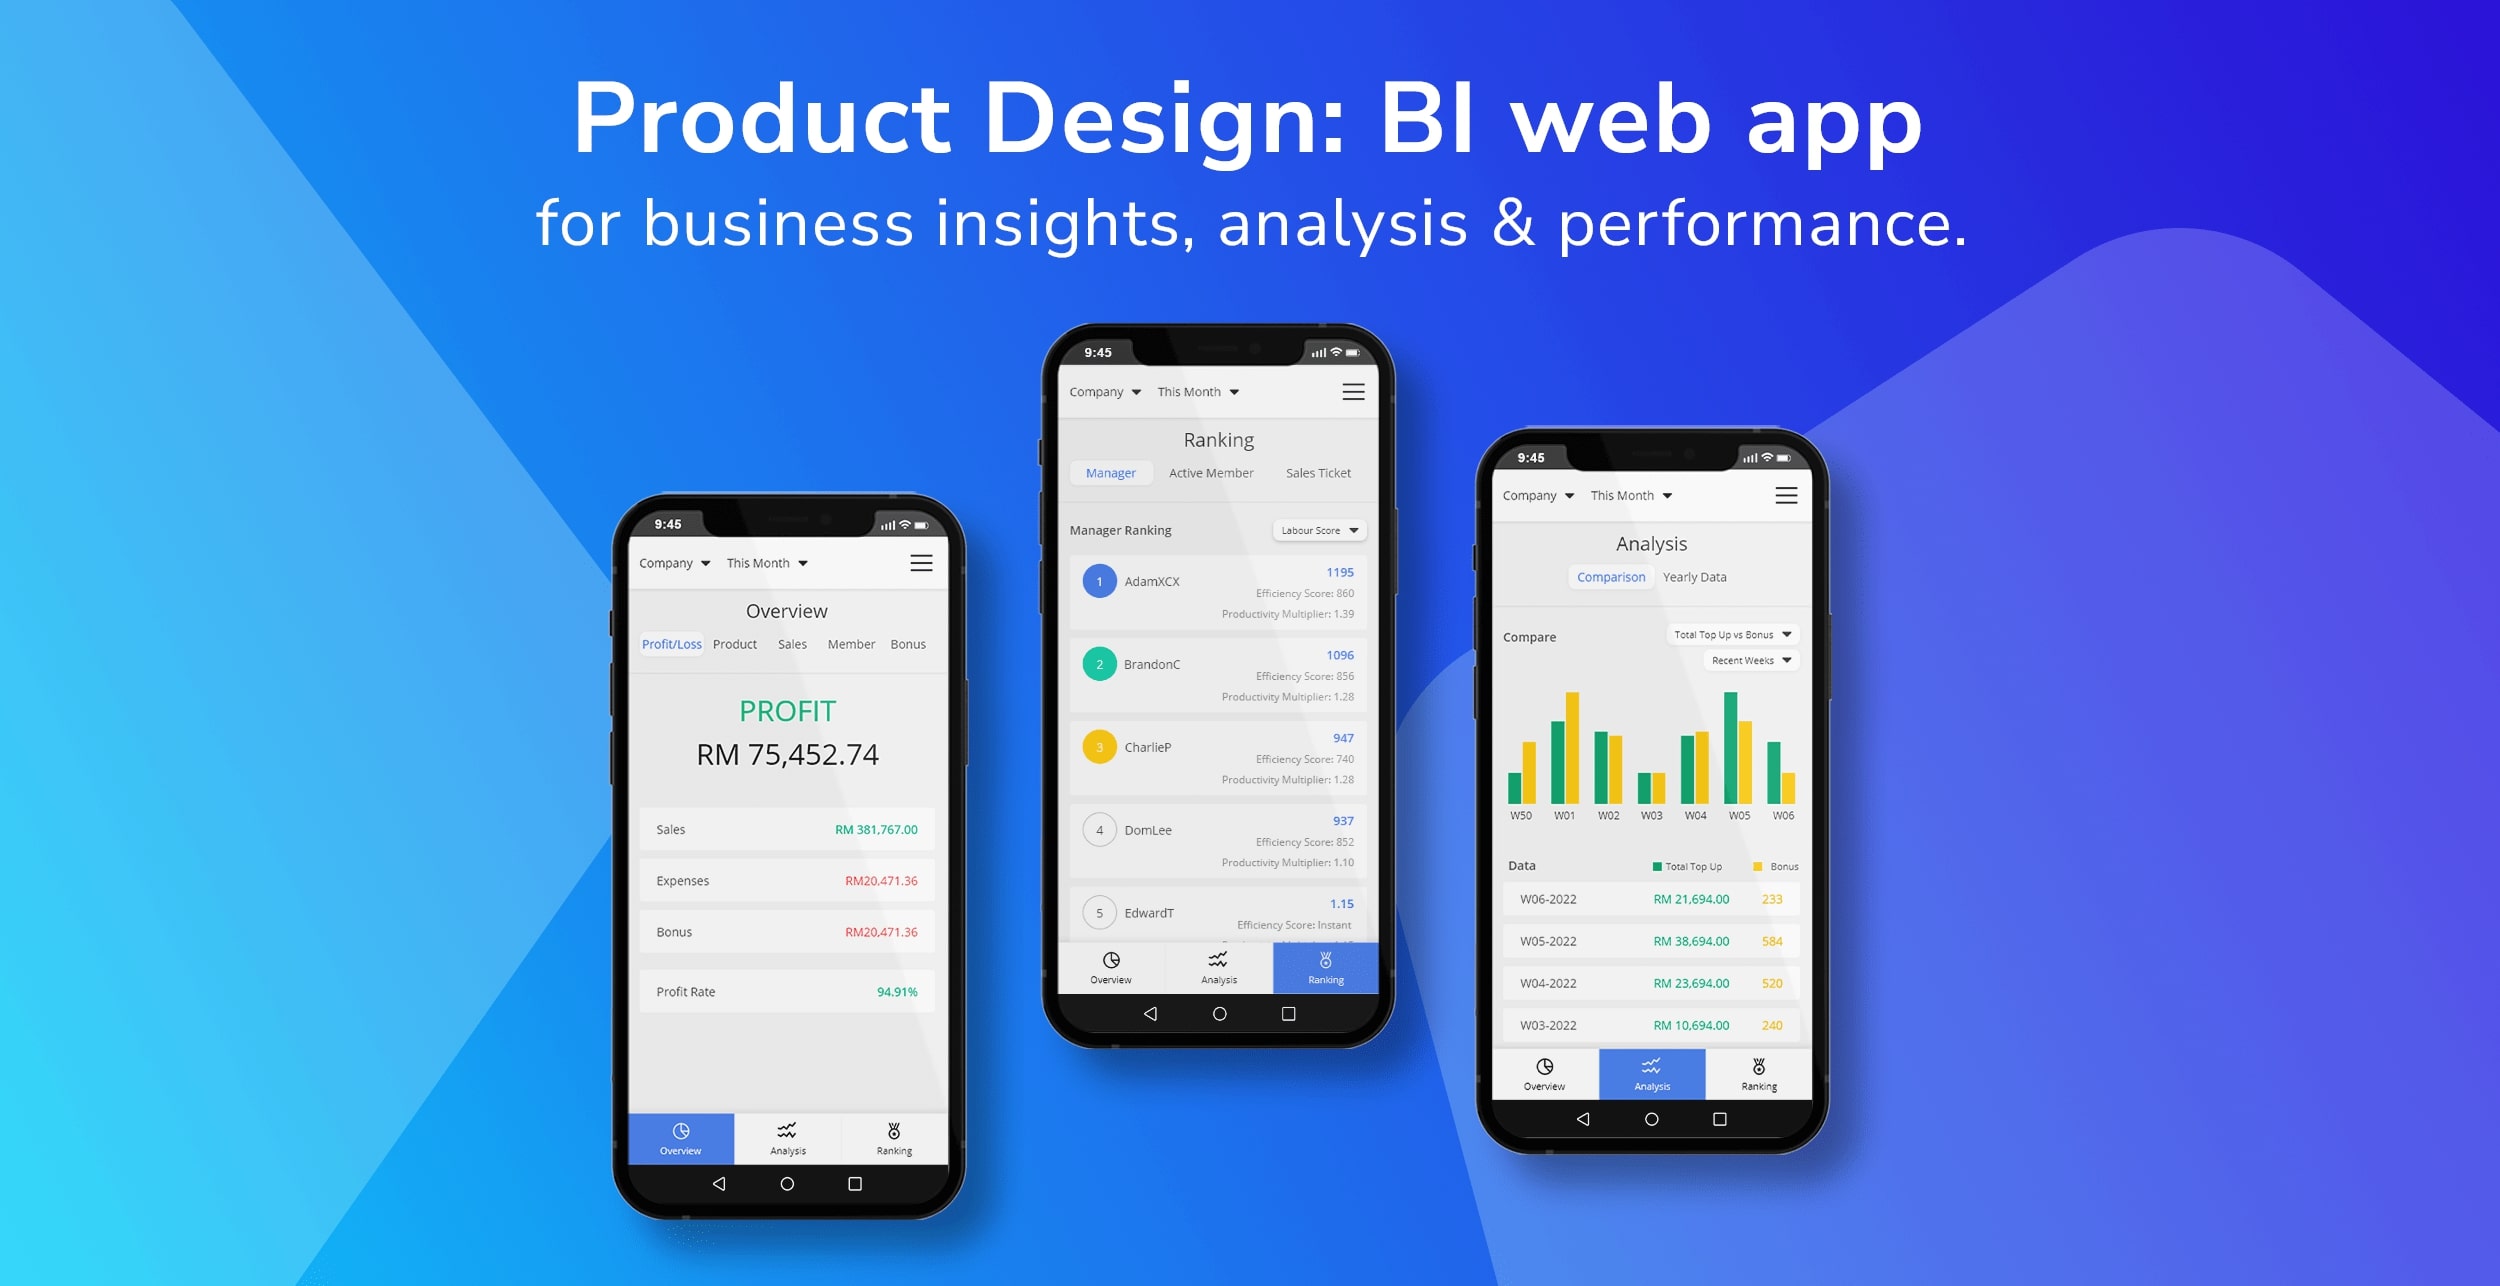
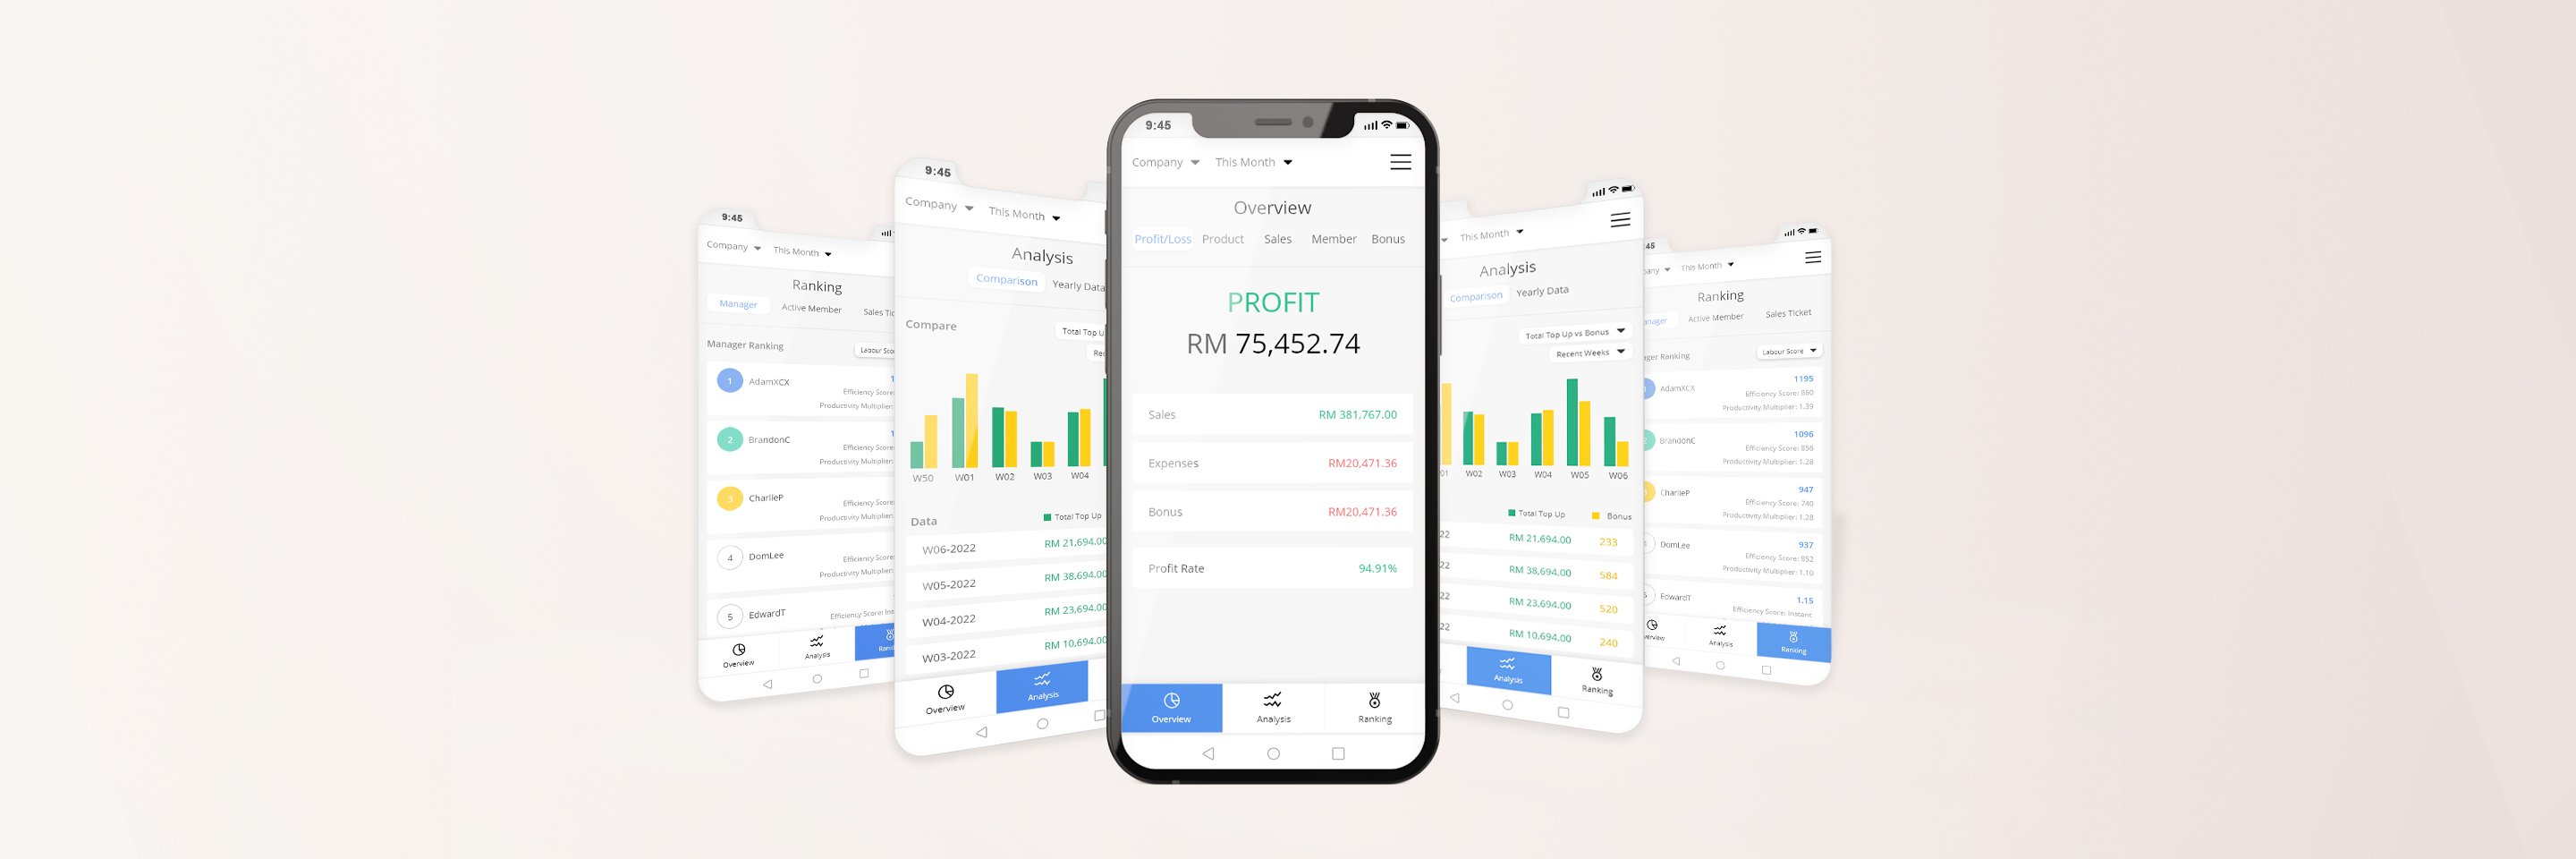
Business Intelligence Web-App
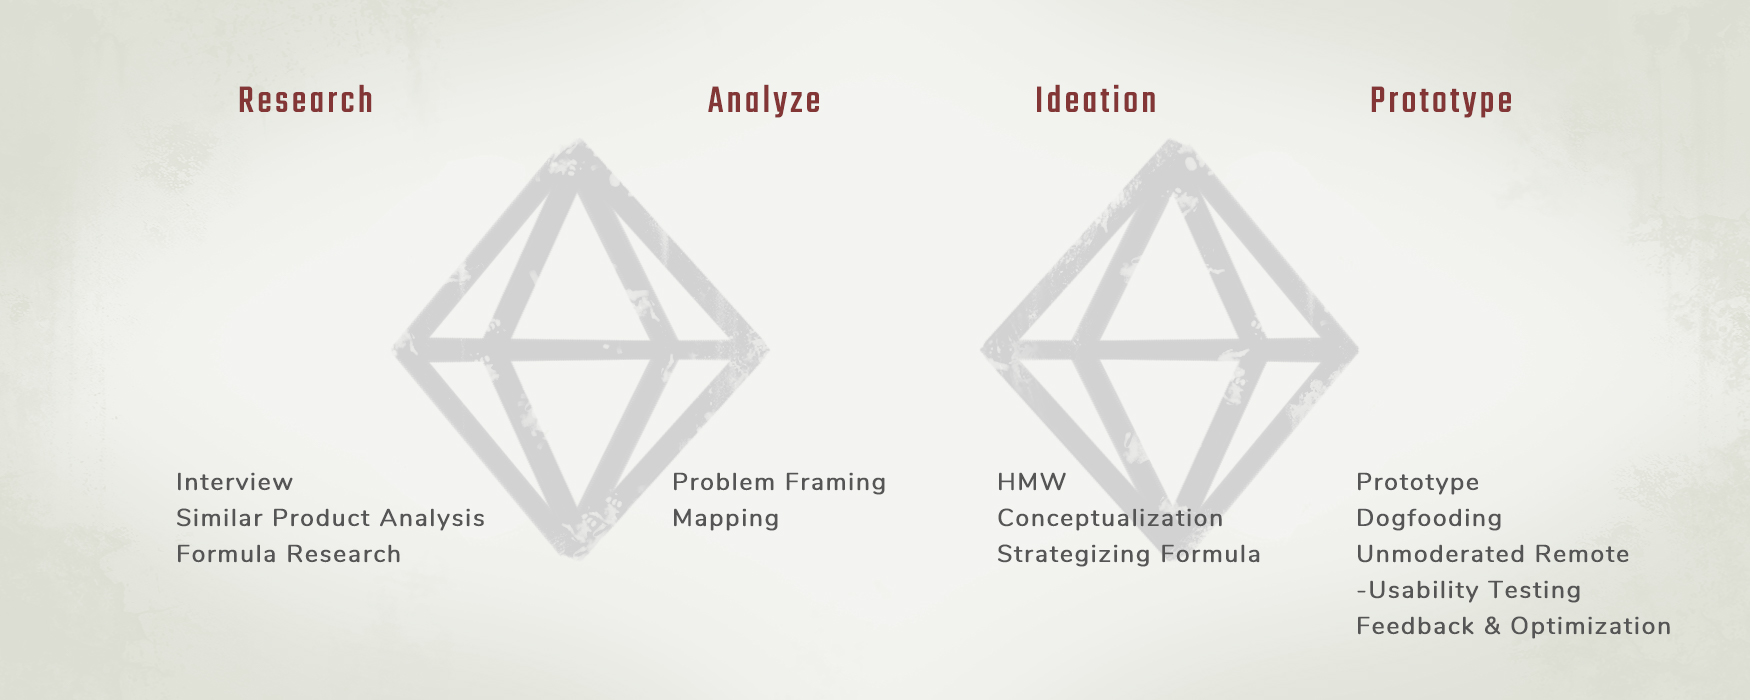
Research, Strategizing Concept, Formulation, Wireframing, Product Design, Optimizing
The web-app is launched and it is being optimized based on clients' feedback. Client requested a platform to analyse their sales business which is dependent on their salesperson and customer service performance. Increasing sales by encouraging salesperson to compete among themselves also part of the platform usage.
I designed a web-app for a sales business to help users analyse and understand their business performance. The design also includes a ranking system for competition to increase sales.
It is challenging to measure business performance without a visually presented data.
Other than that, there is no exact formula for specific business to measure performance, not to mention a fair competition system to measure sales.
Moreover, the users of the web-app are mostly not tech-savvy & might not understand complicated data.
How can we design a web app, simple enough for users to measure and analyse their business performance, including a fair internal system that improve sales?
To increase performance of business with the aid of this web-app.
The framework and method used throughout the project.
This project started with an interview, in which plays a very crucial part for this project. The main users are the managers.
To understand more about the users and the nature of their work, questions are prepared and every possible aspect regarding the role of the users are asked. For instance, how they’re going to use it, purposes, flow such as customer service process, business planning, data required for measuring performance and variety of sales criteria.
Aside from designing a web-app that are useful in which will ease their job and save their time, it is also important to ensure the web-app is easy to use because the users are mostly not tech-savvy, and that was one of the challenges in this project!
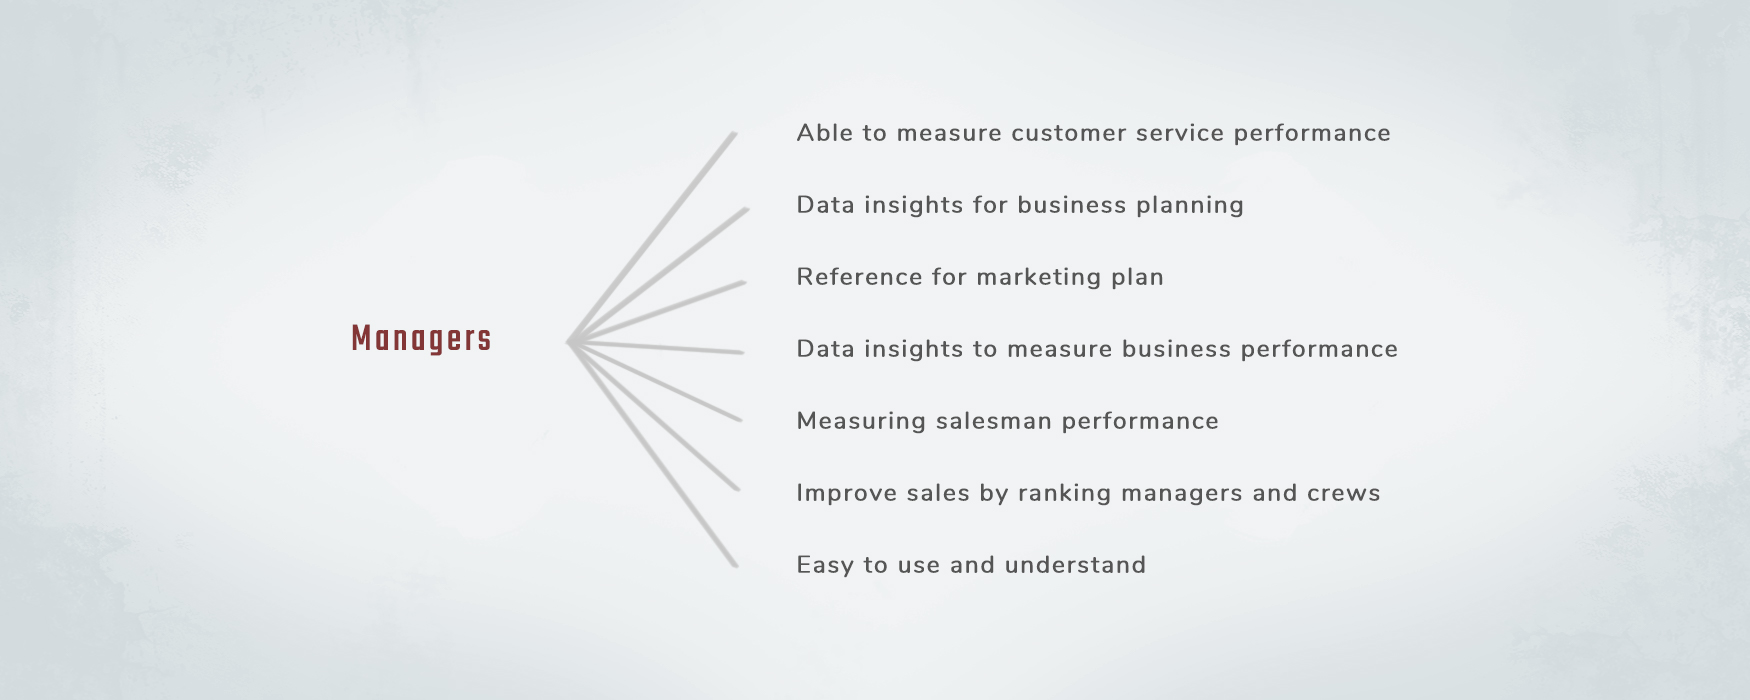
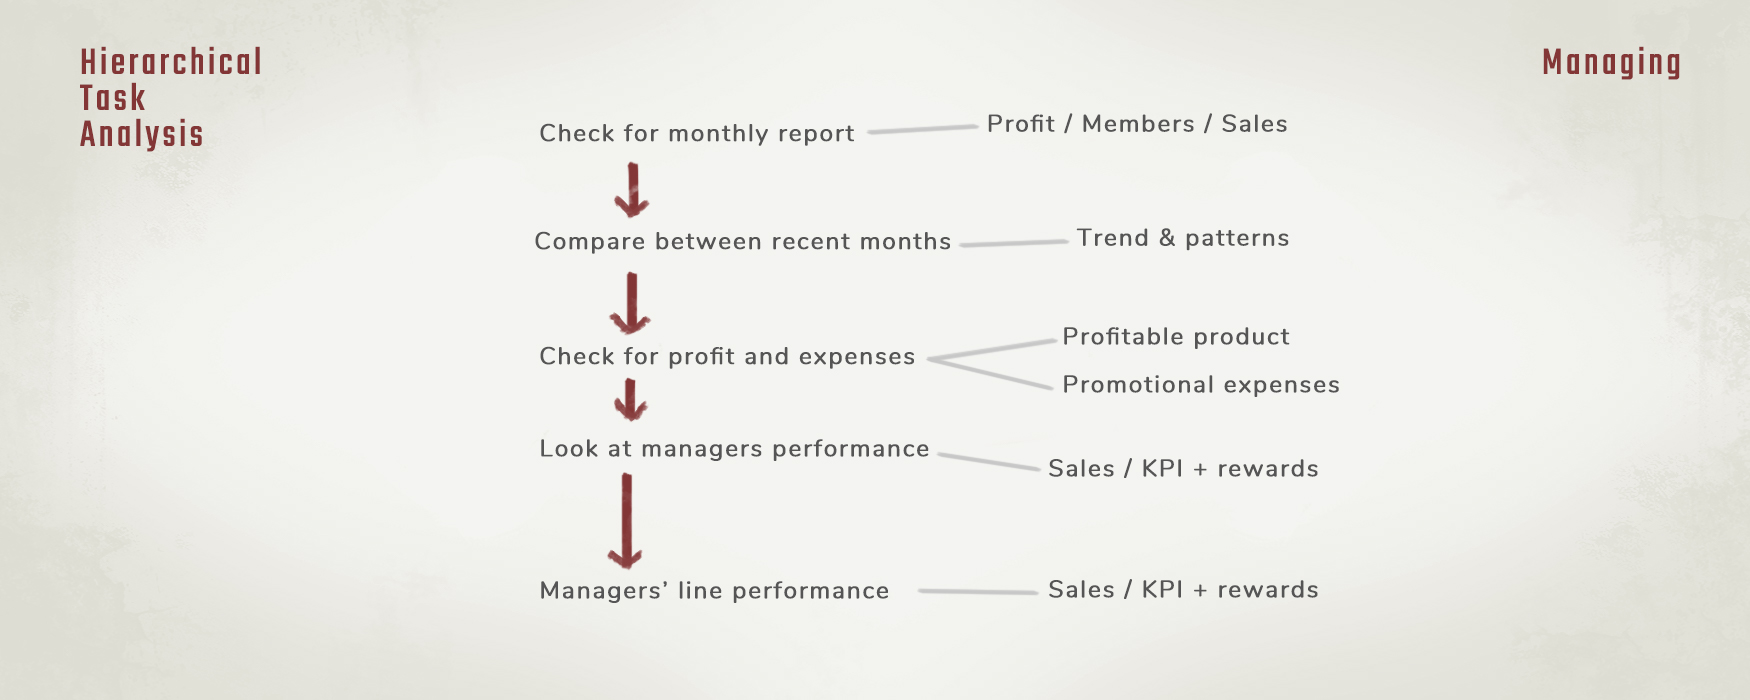
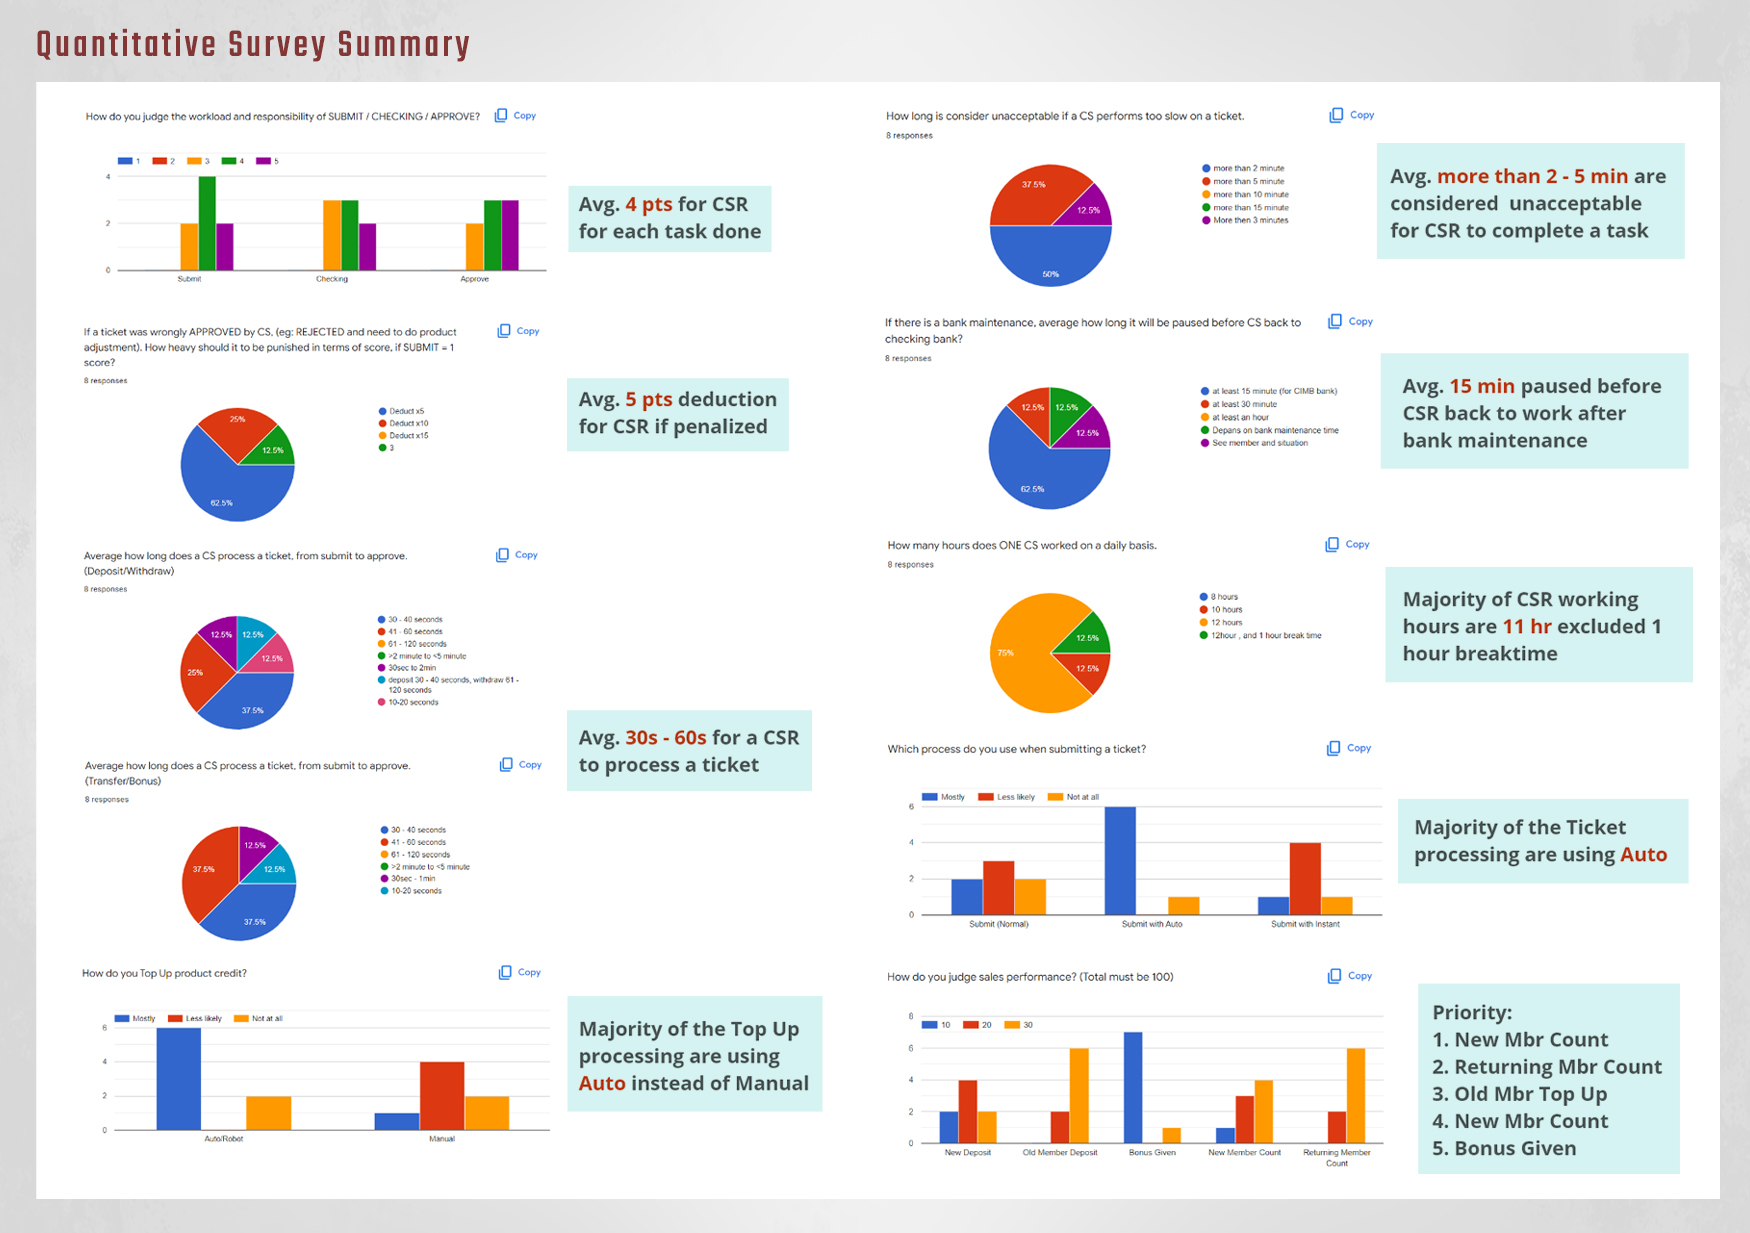
Further questions are asked after the interview, via both quantitative and qualitative surveys. With the information gathered from the interview and survey responses, a task hierarchy of the users managing their business is summarized as below.
Research about the available formula & graphs out there on the internet, to study and analyse how they work, difficulties to understand, and suitability for this project.
The keywords of the research for this case are sales, business intelligence, data analysis, profit, performance, and trend.
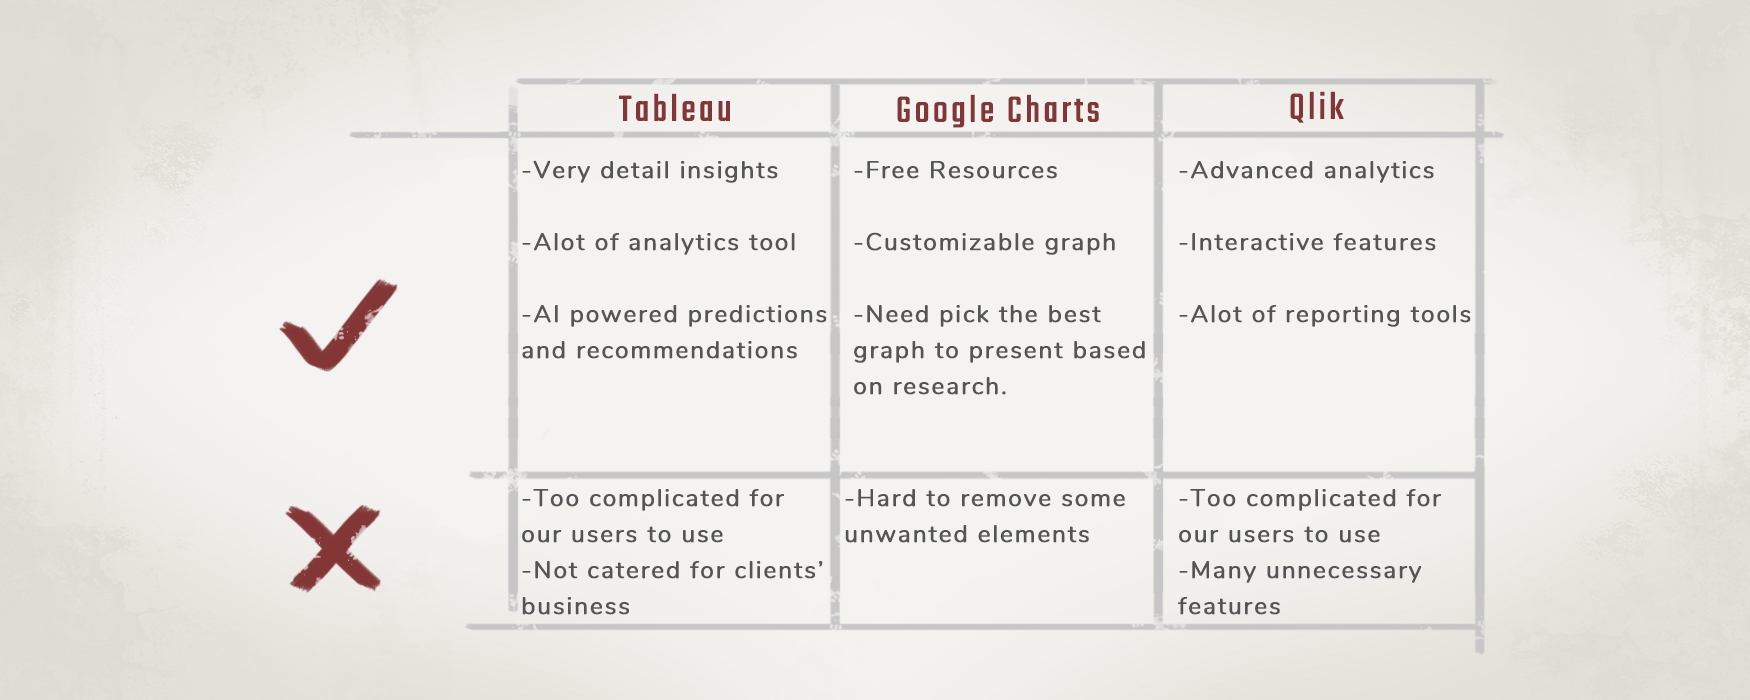
Software such as Tableau and Qlik are also used as references to study how they present data and the effectiveness in usage of graphs and charts.
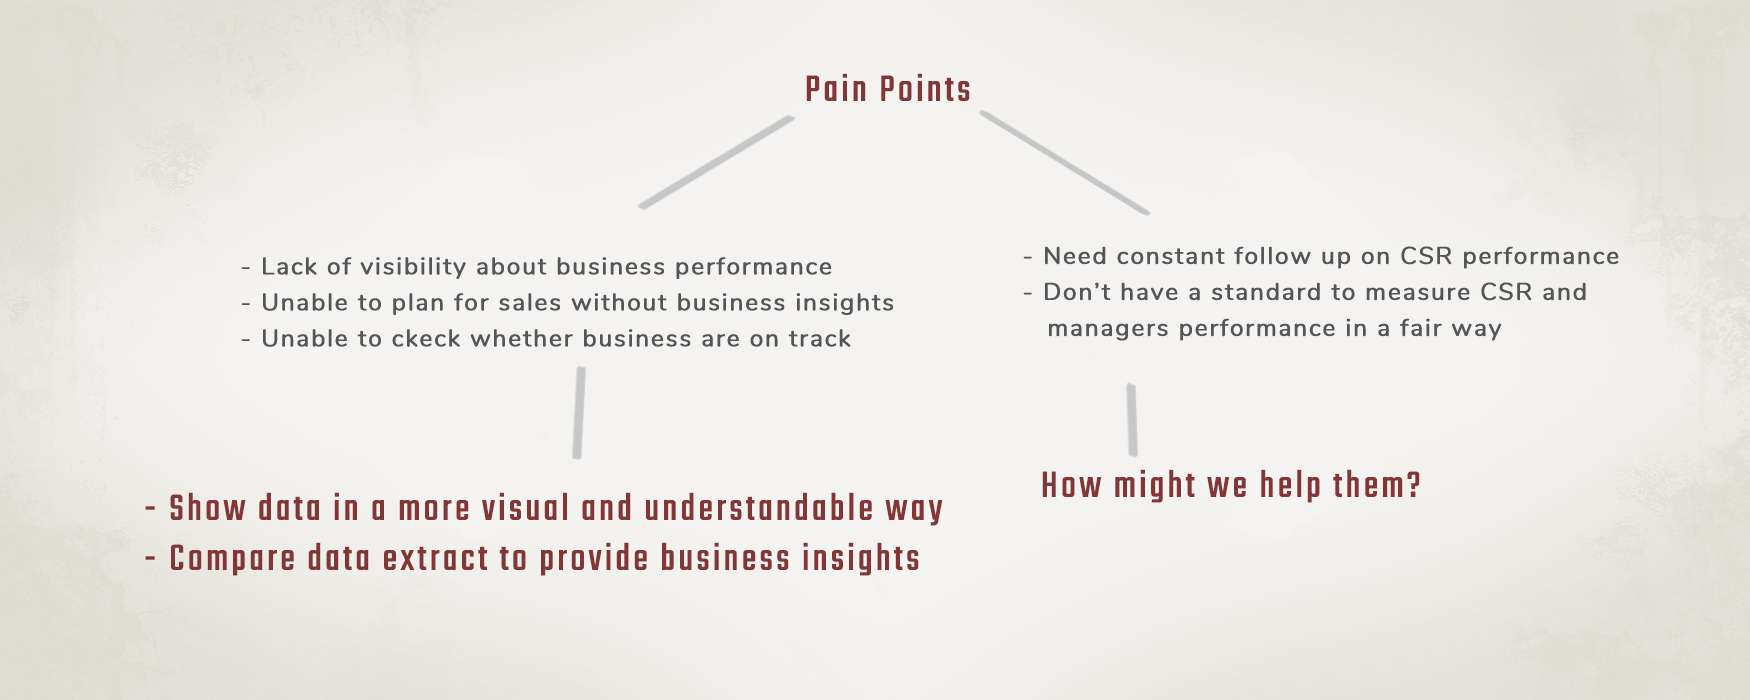
The user pain points are lack of visibility about the business performance and unable to constantly follow up about their employee performance.
They will need these business insights for evaluating employees' performance and future business plan, like predicting the best time for promotions or new product towards targeting customers.
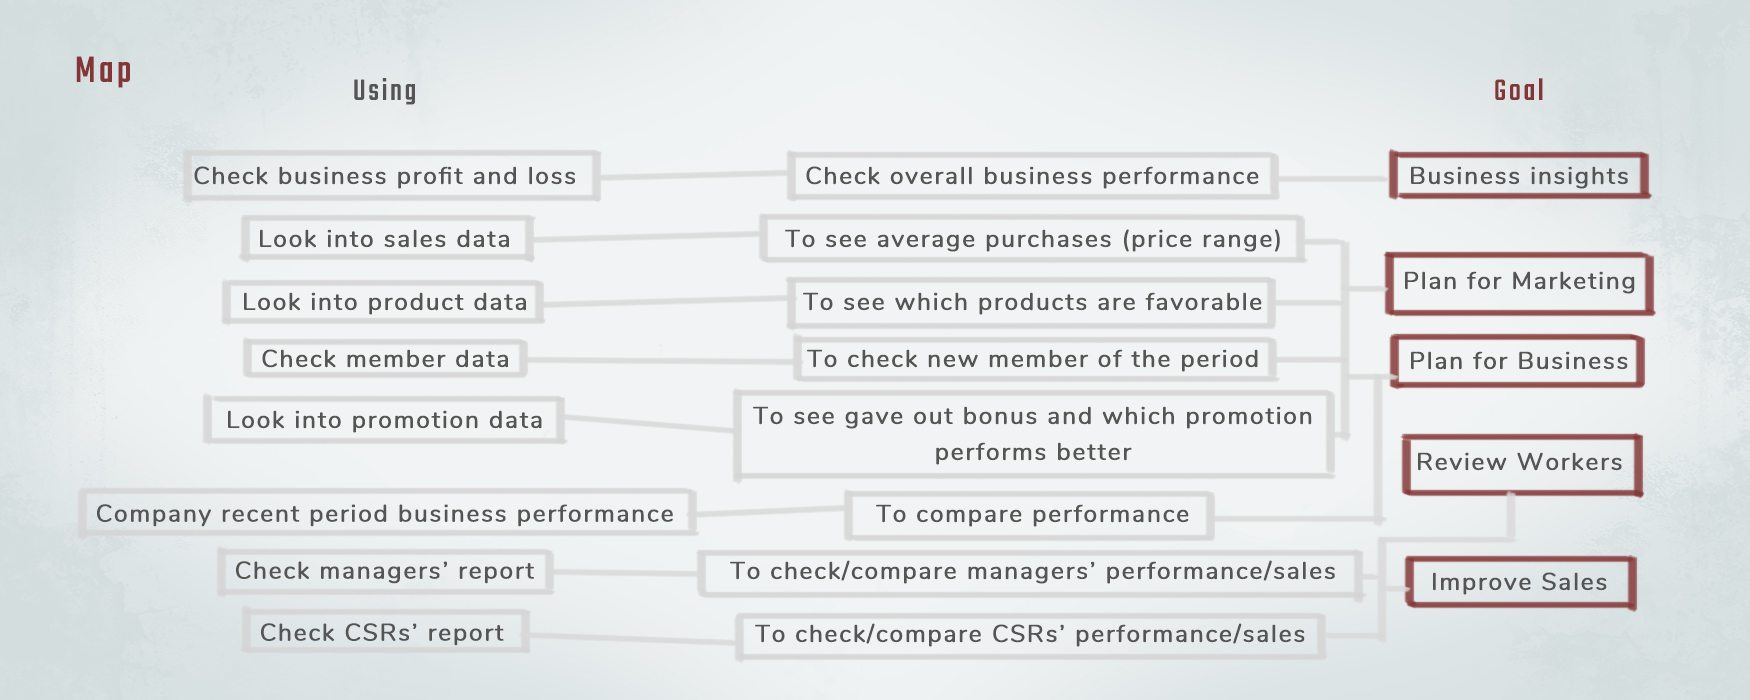
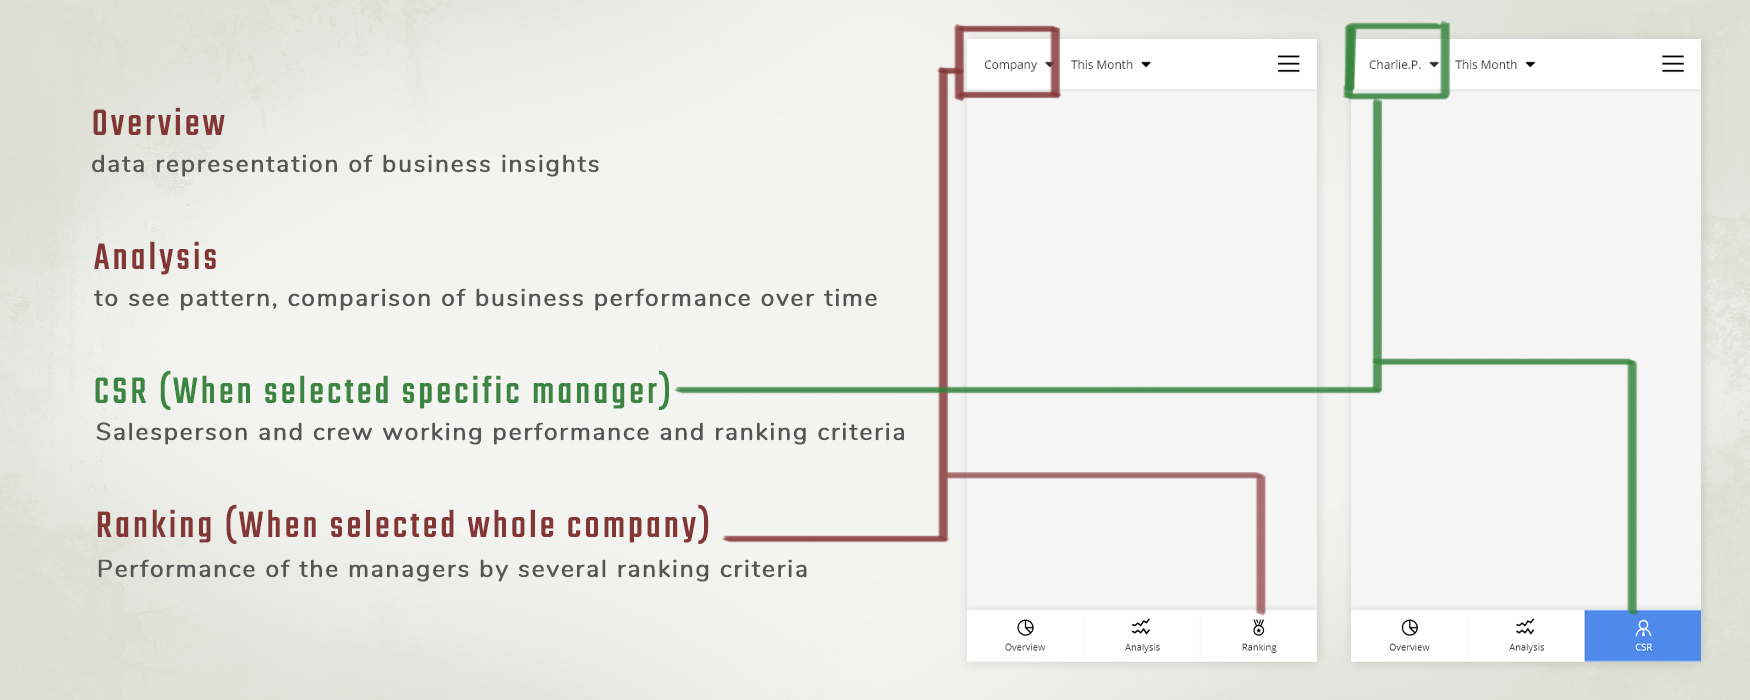
To have a clearer picture during discussion with the team, a map of user with different goal and process are summarized.
We all agreed that the method of presenting data should be easily understandable and avoid complicated functions.
Facing all the problems at once is quite horrifying when there’s a long list collected from the beginning process, so I decided to sort the problems first by priorities of lowest effort and high effectiveness first.
Choosing the data presenting method comes first, then, choosing method of comparing performance from data, and lastly, formulation and designing a standard for measuring performance.
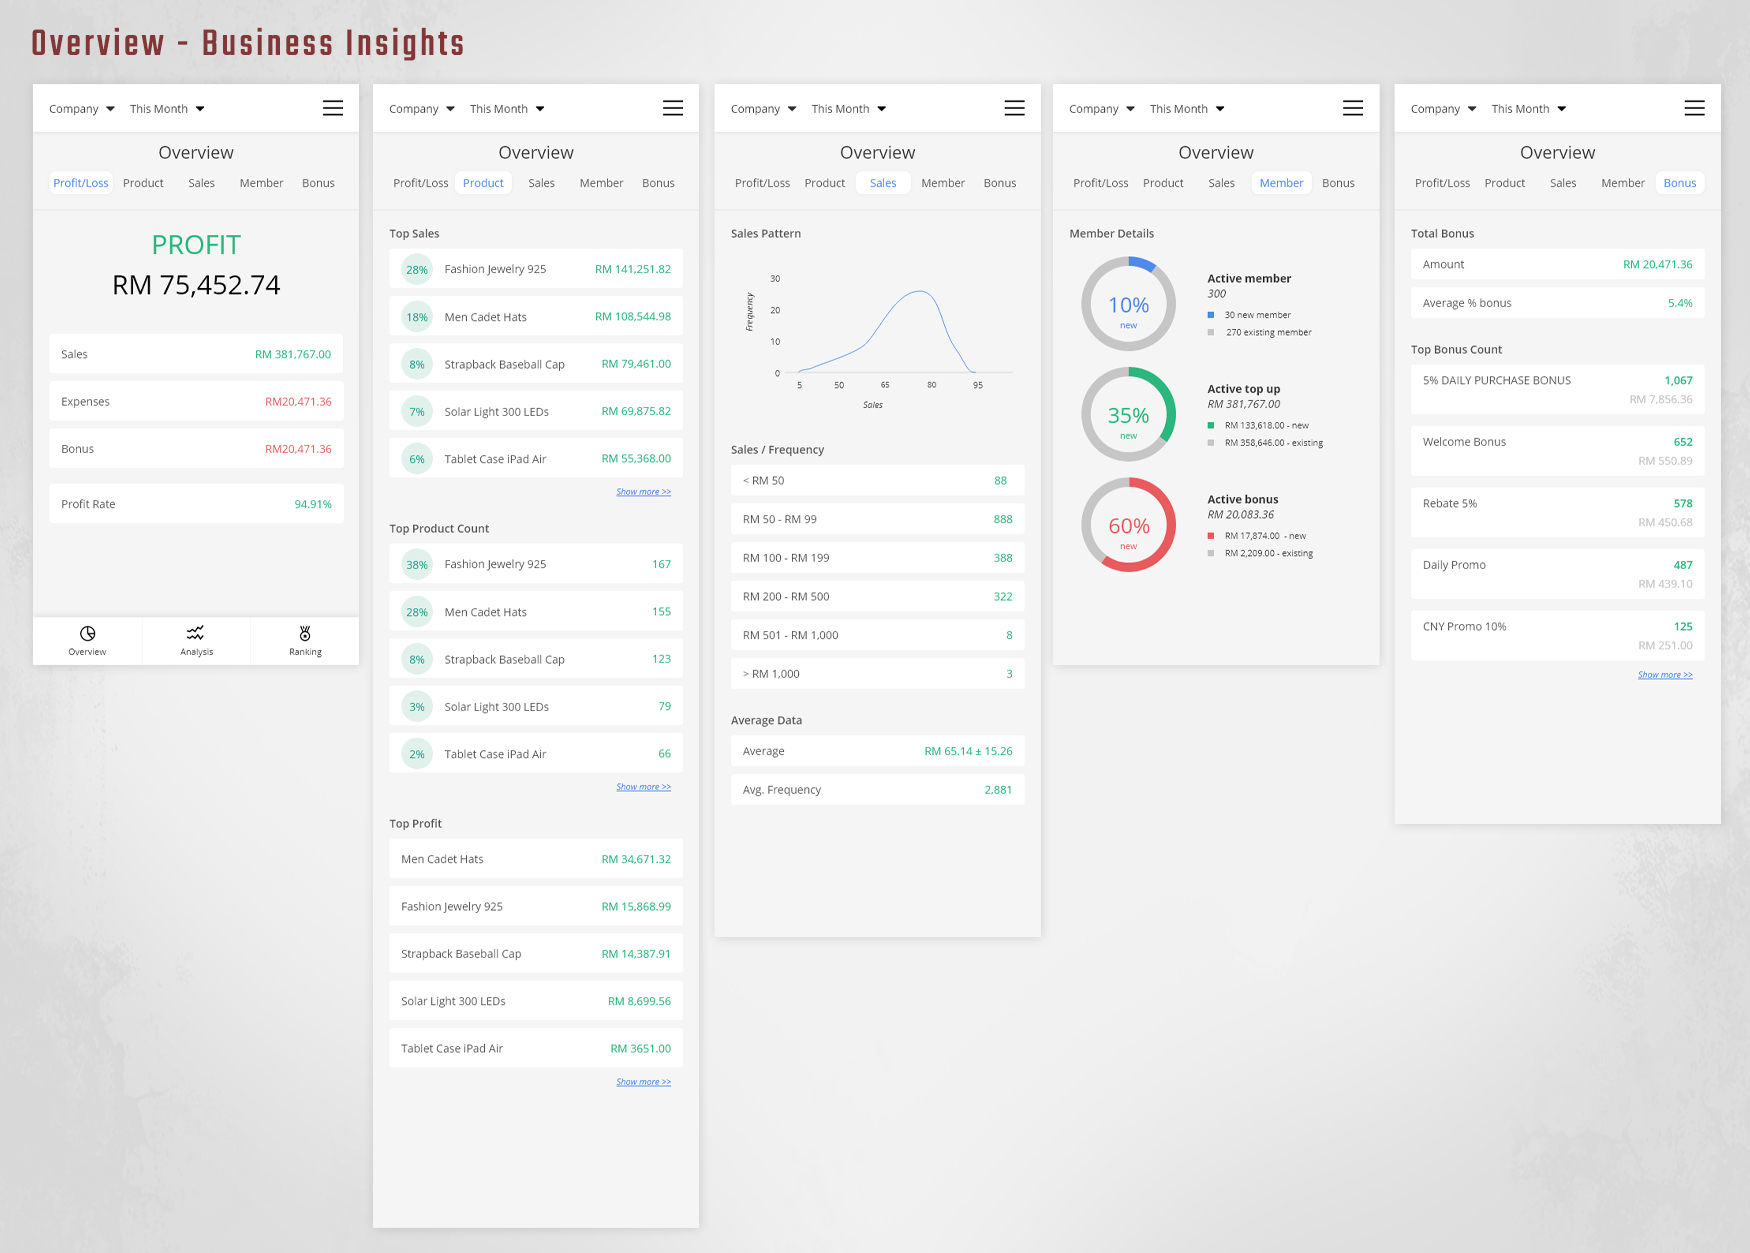
Future planning in a business such as marketing plan required several data set in order to carry out effectively. For instance, the target customer group, most purchased product, and type of promotion.
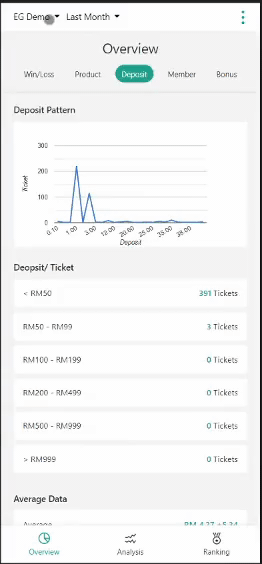
We differentiate the customer group by showing graph of purchasing price to have a deeper insights of the customers’ comfortable price range and to plan the promotion price range.
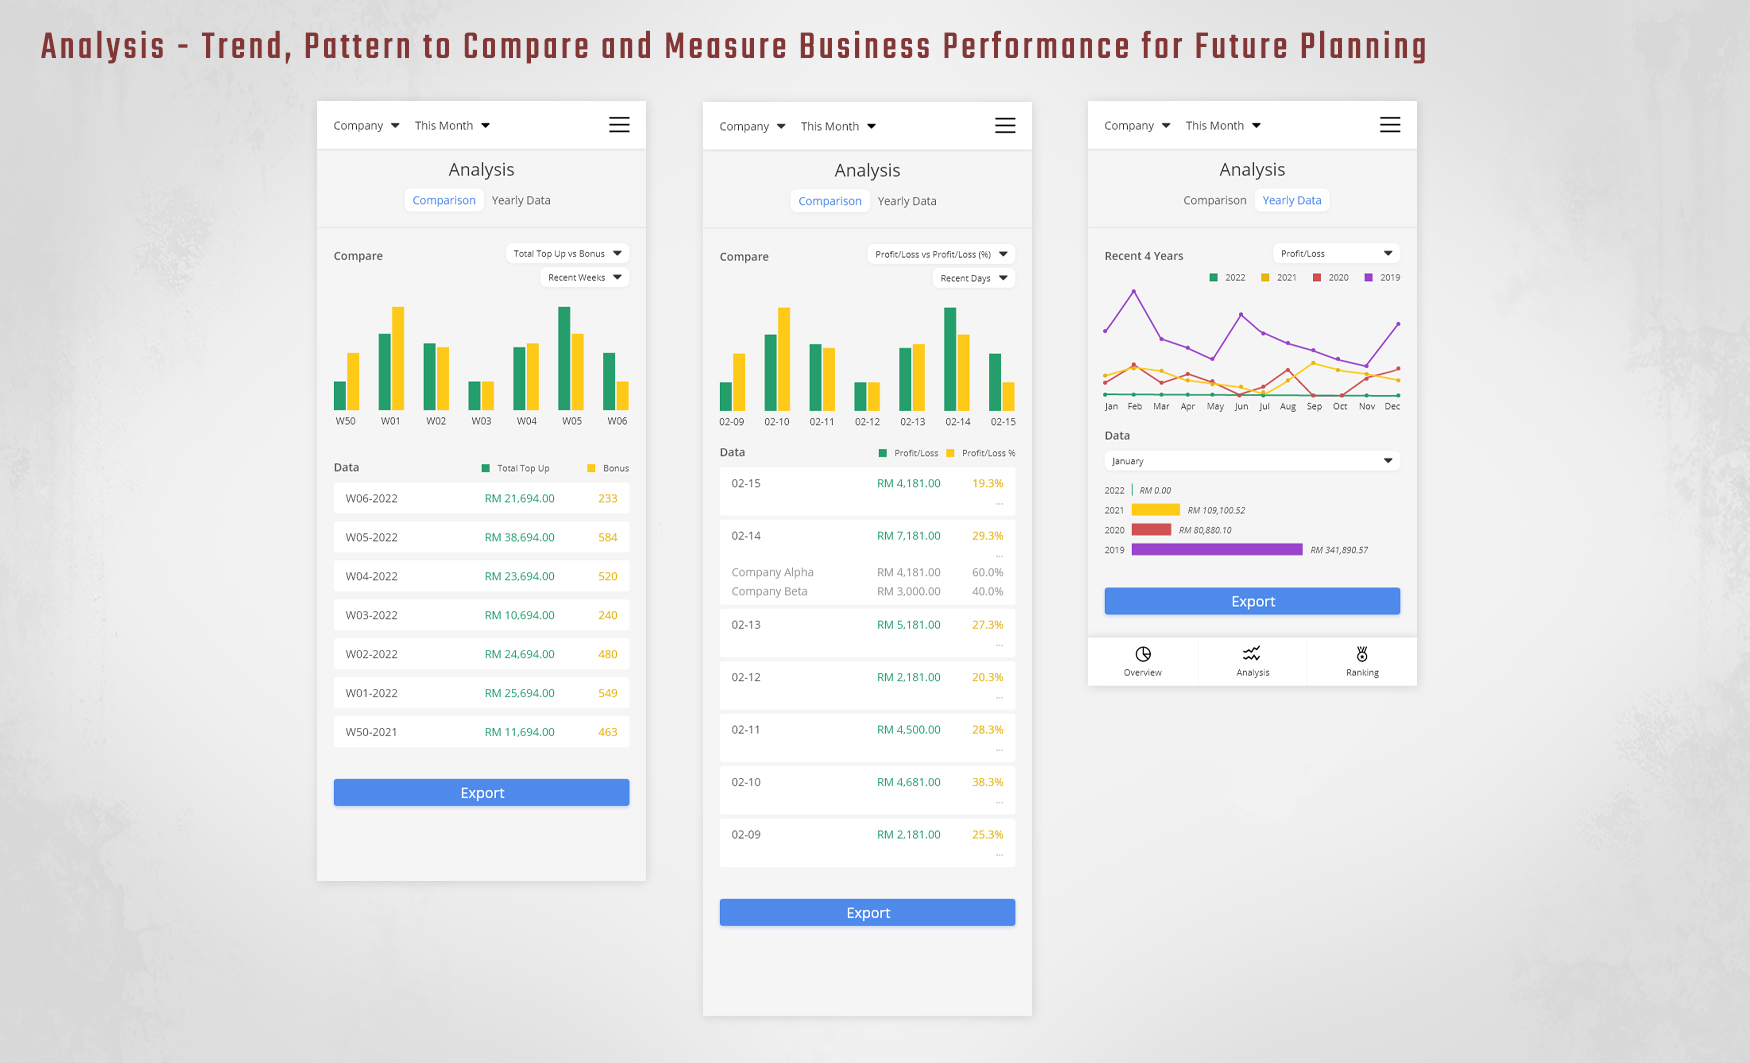
We also have analysis part for the user to compare and see past pattern to measure performance accordingly, by including different criteria that affect each other to cause an impact to the business.
How might we measure the customer service representative (CSR), managers, and salesman performance catered to one’s business? It is very tough to measure and design a standard for the performance of a CSR when their performance involved time, count of the tickets processed, different type of ticket and different process altogether in one score.
Hence, I proposed a way to measure efficiency with time and productivity score with tickets. In this way, requirements are accounted, and both of them have its own unique indication for the performance.
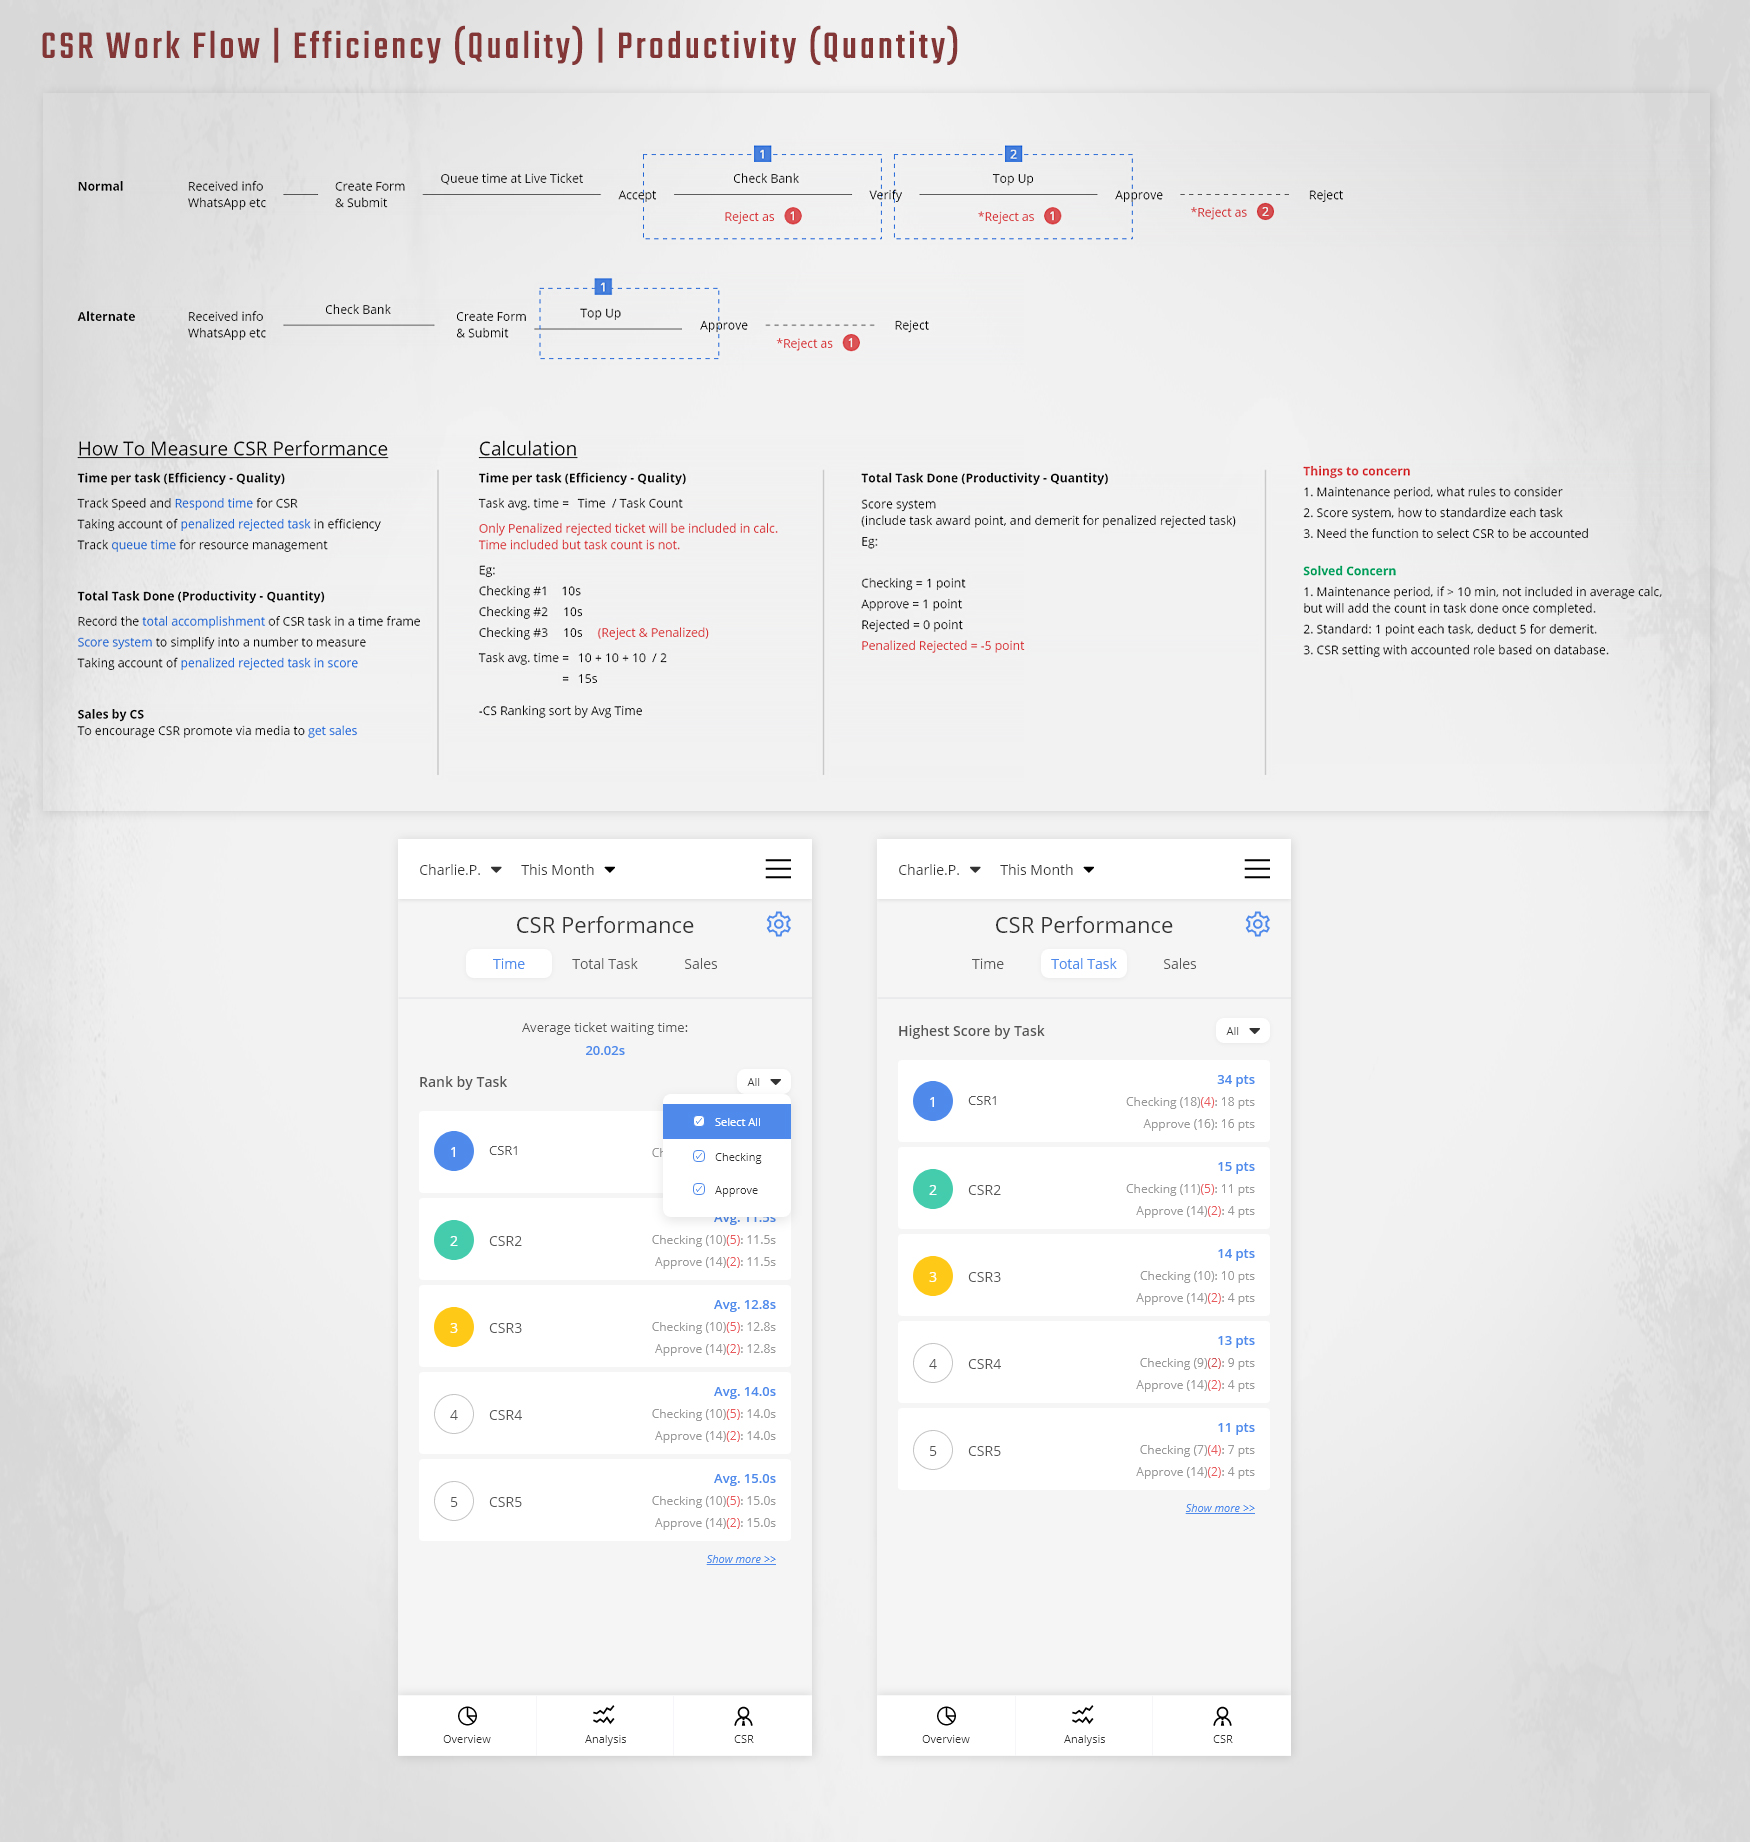
To improve customer service performance, the managers will reward them based on the score which is affected by a merit system. Their points get demerit when they do the task wrongly.
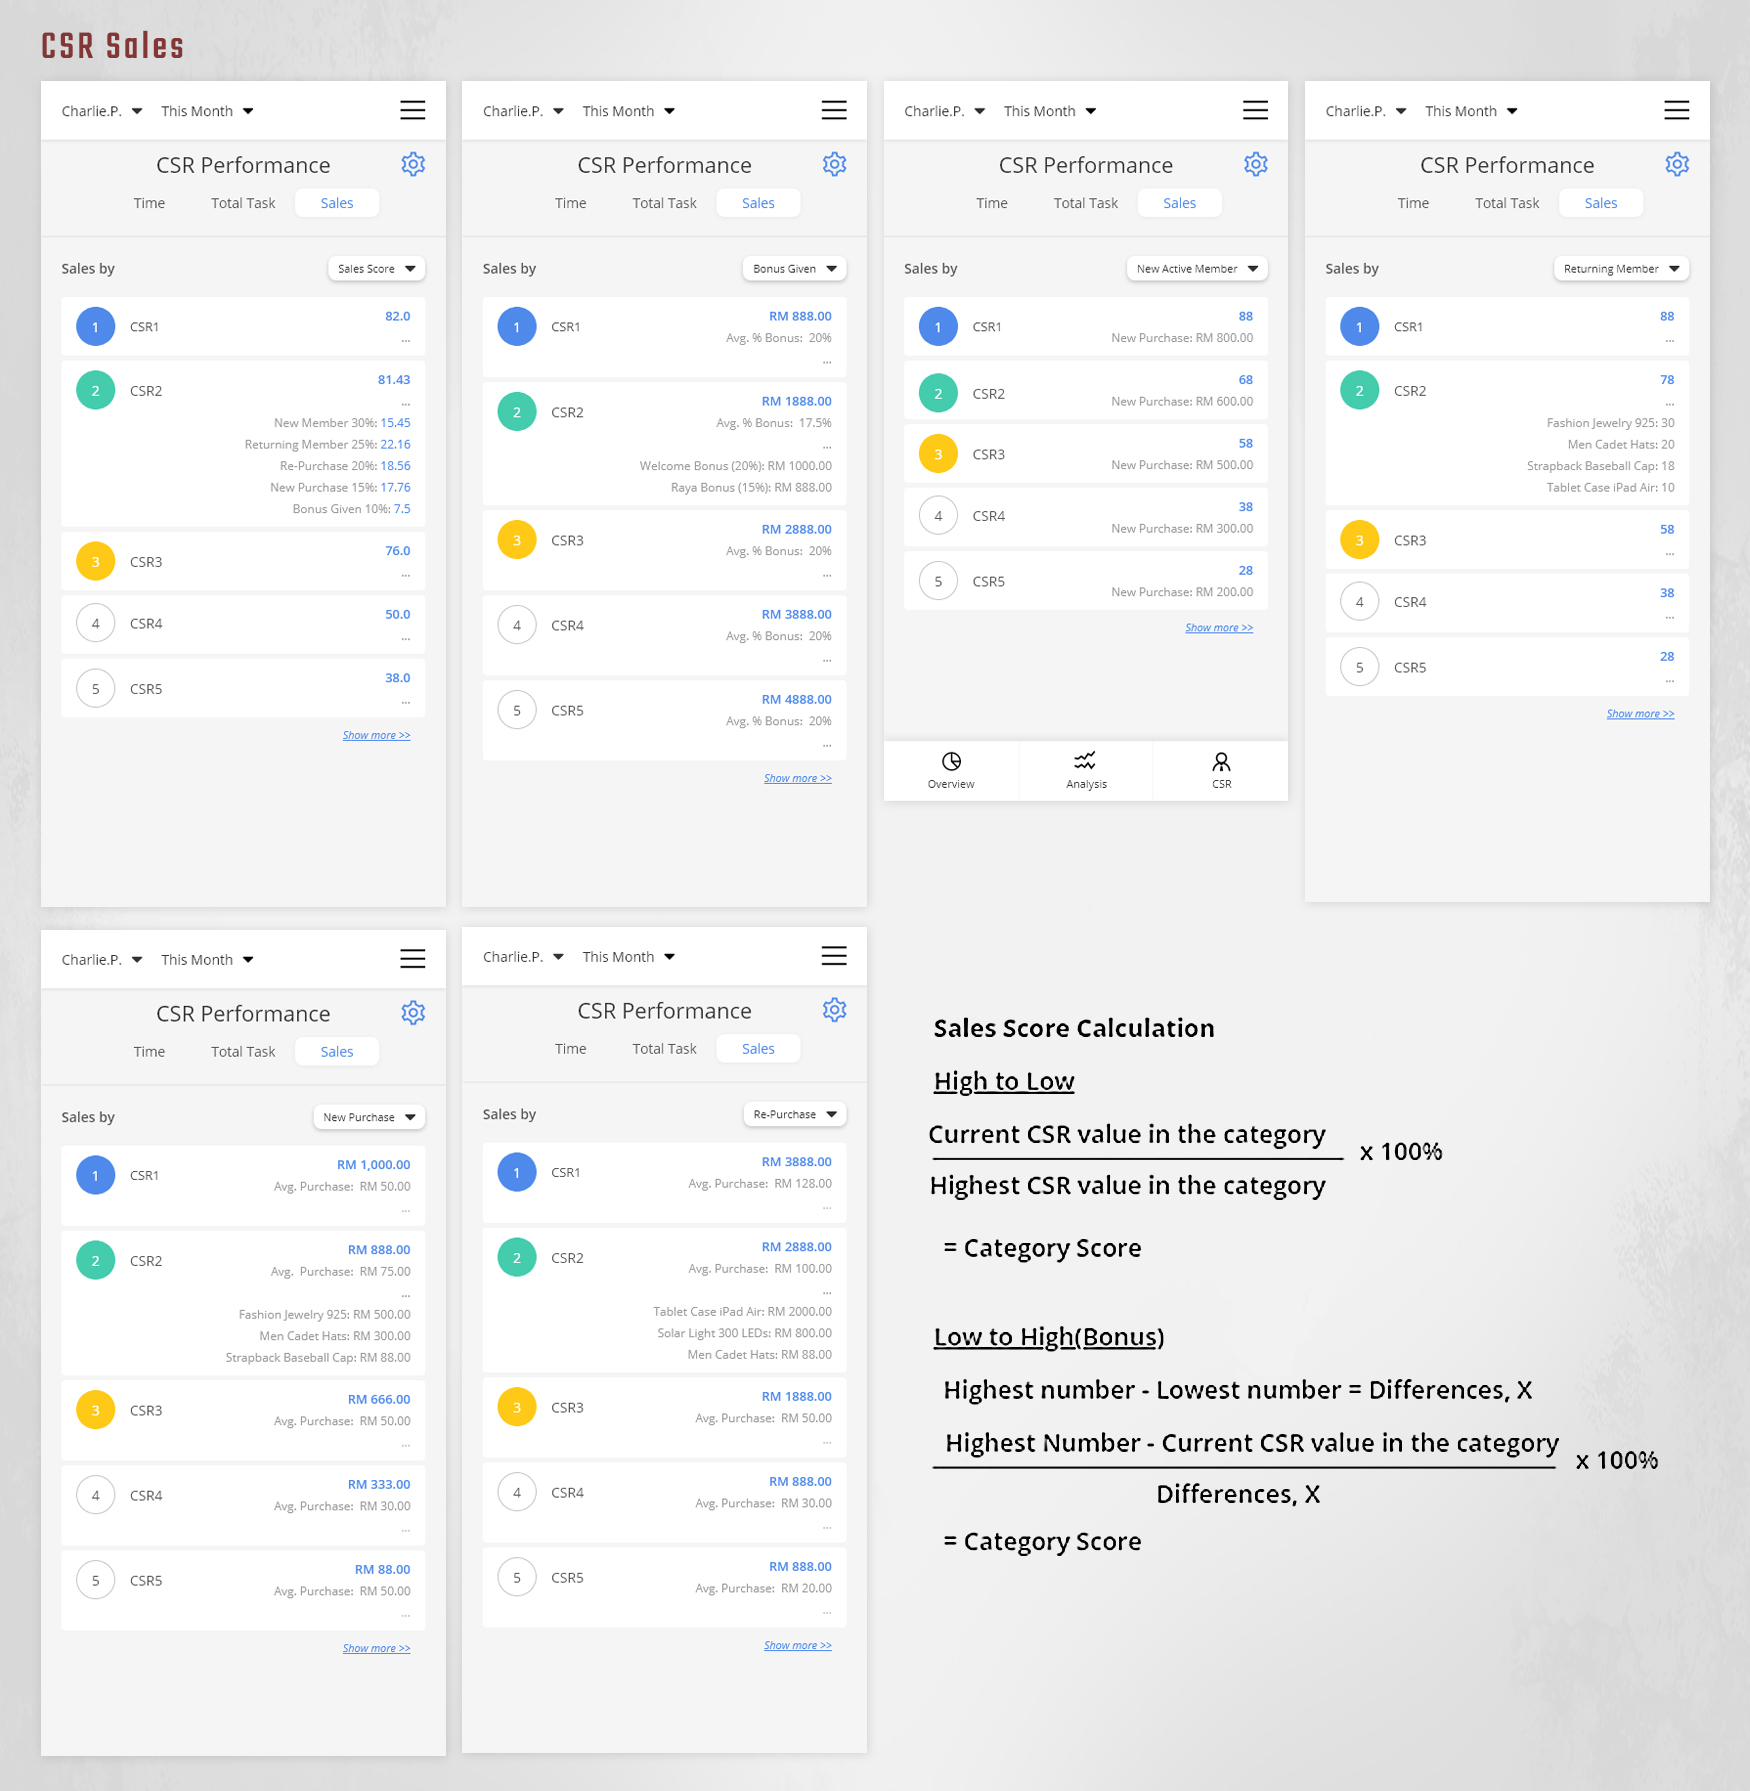
As for sales, the scores are calculated from different criteria, it was discussed and standardized based on clients’ and users’ feedback. Each category also will display related data for further insights and sort by top product.
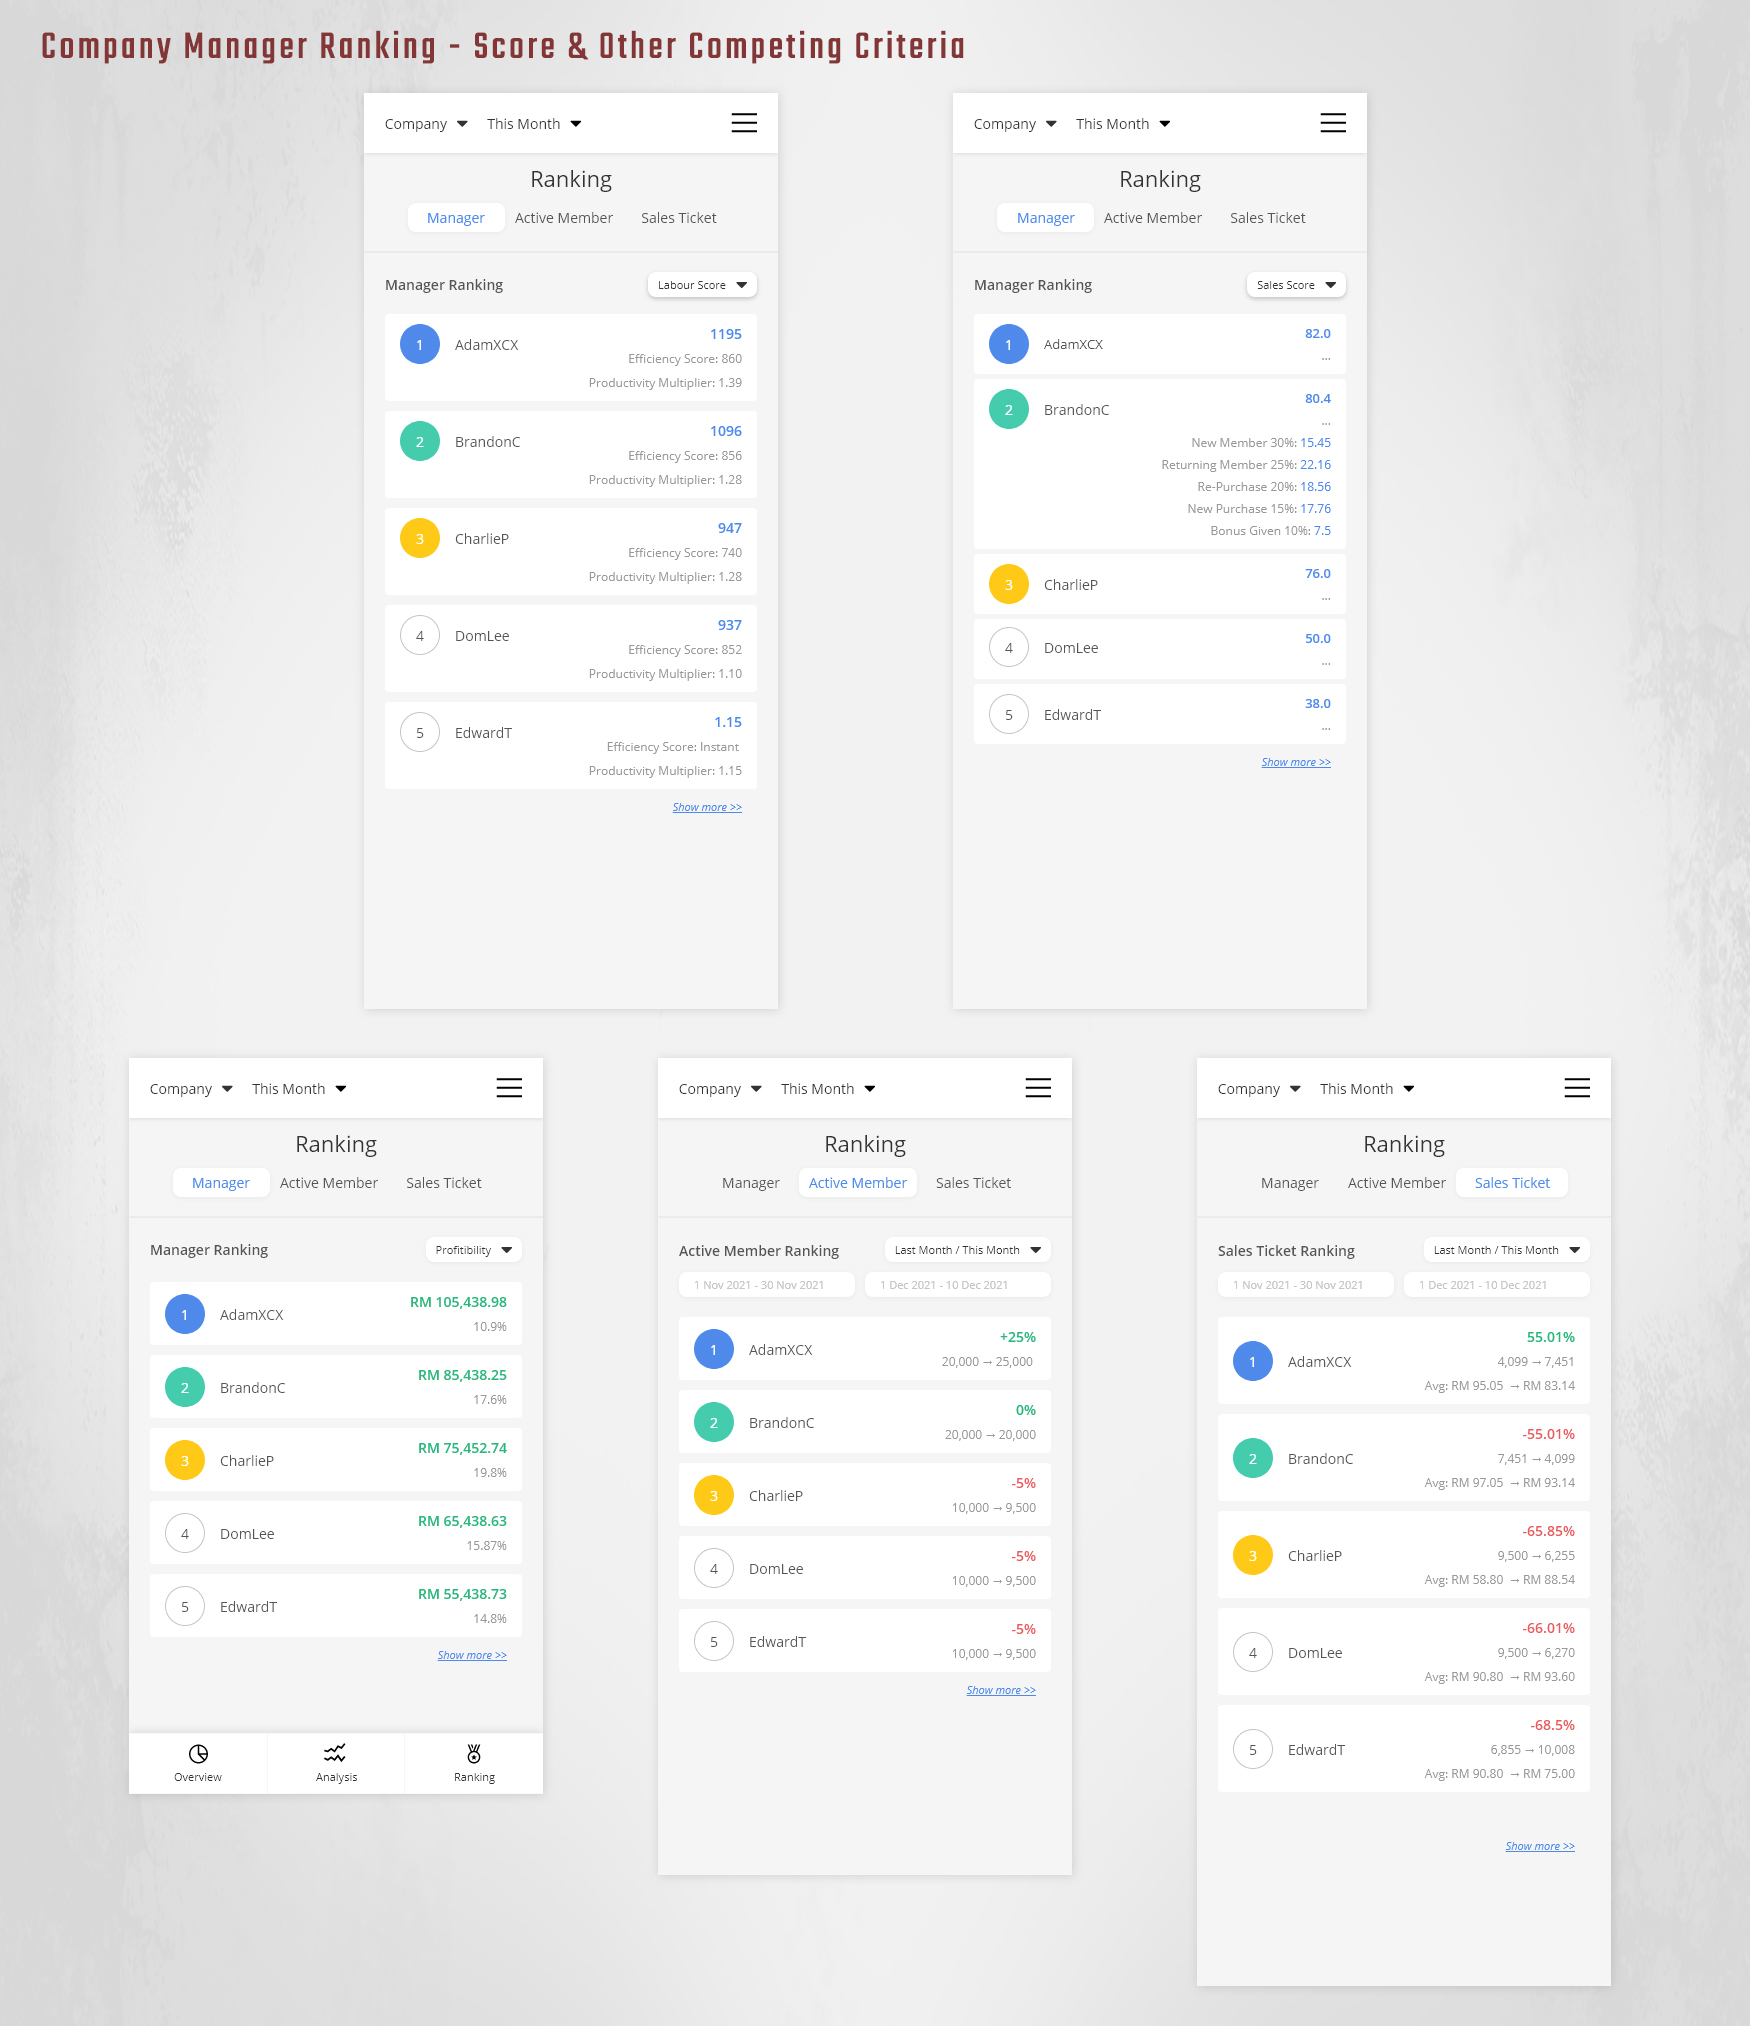
Next up, to rank the managers, we have to think of a way to measure both the efficiency and productivity of the manager’s team in ONE standard formula.
As nerdy as it sounds, I combined the formula using the concept of “decay” and “inverse exponential” back in the university days, with “growth” rate as modifiers to fulfil the competition requirements.
In a nutshell, the higher efficiency and productivity you are, the higher score you will get, exponentially. So, the managers will compete among themselves to stay on top for the reward, so as the business will improve.
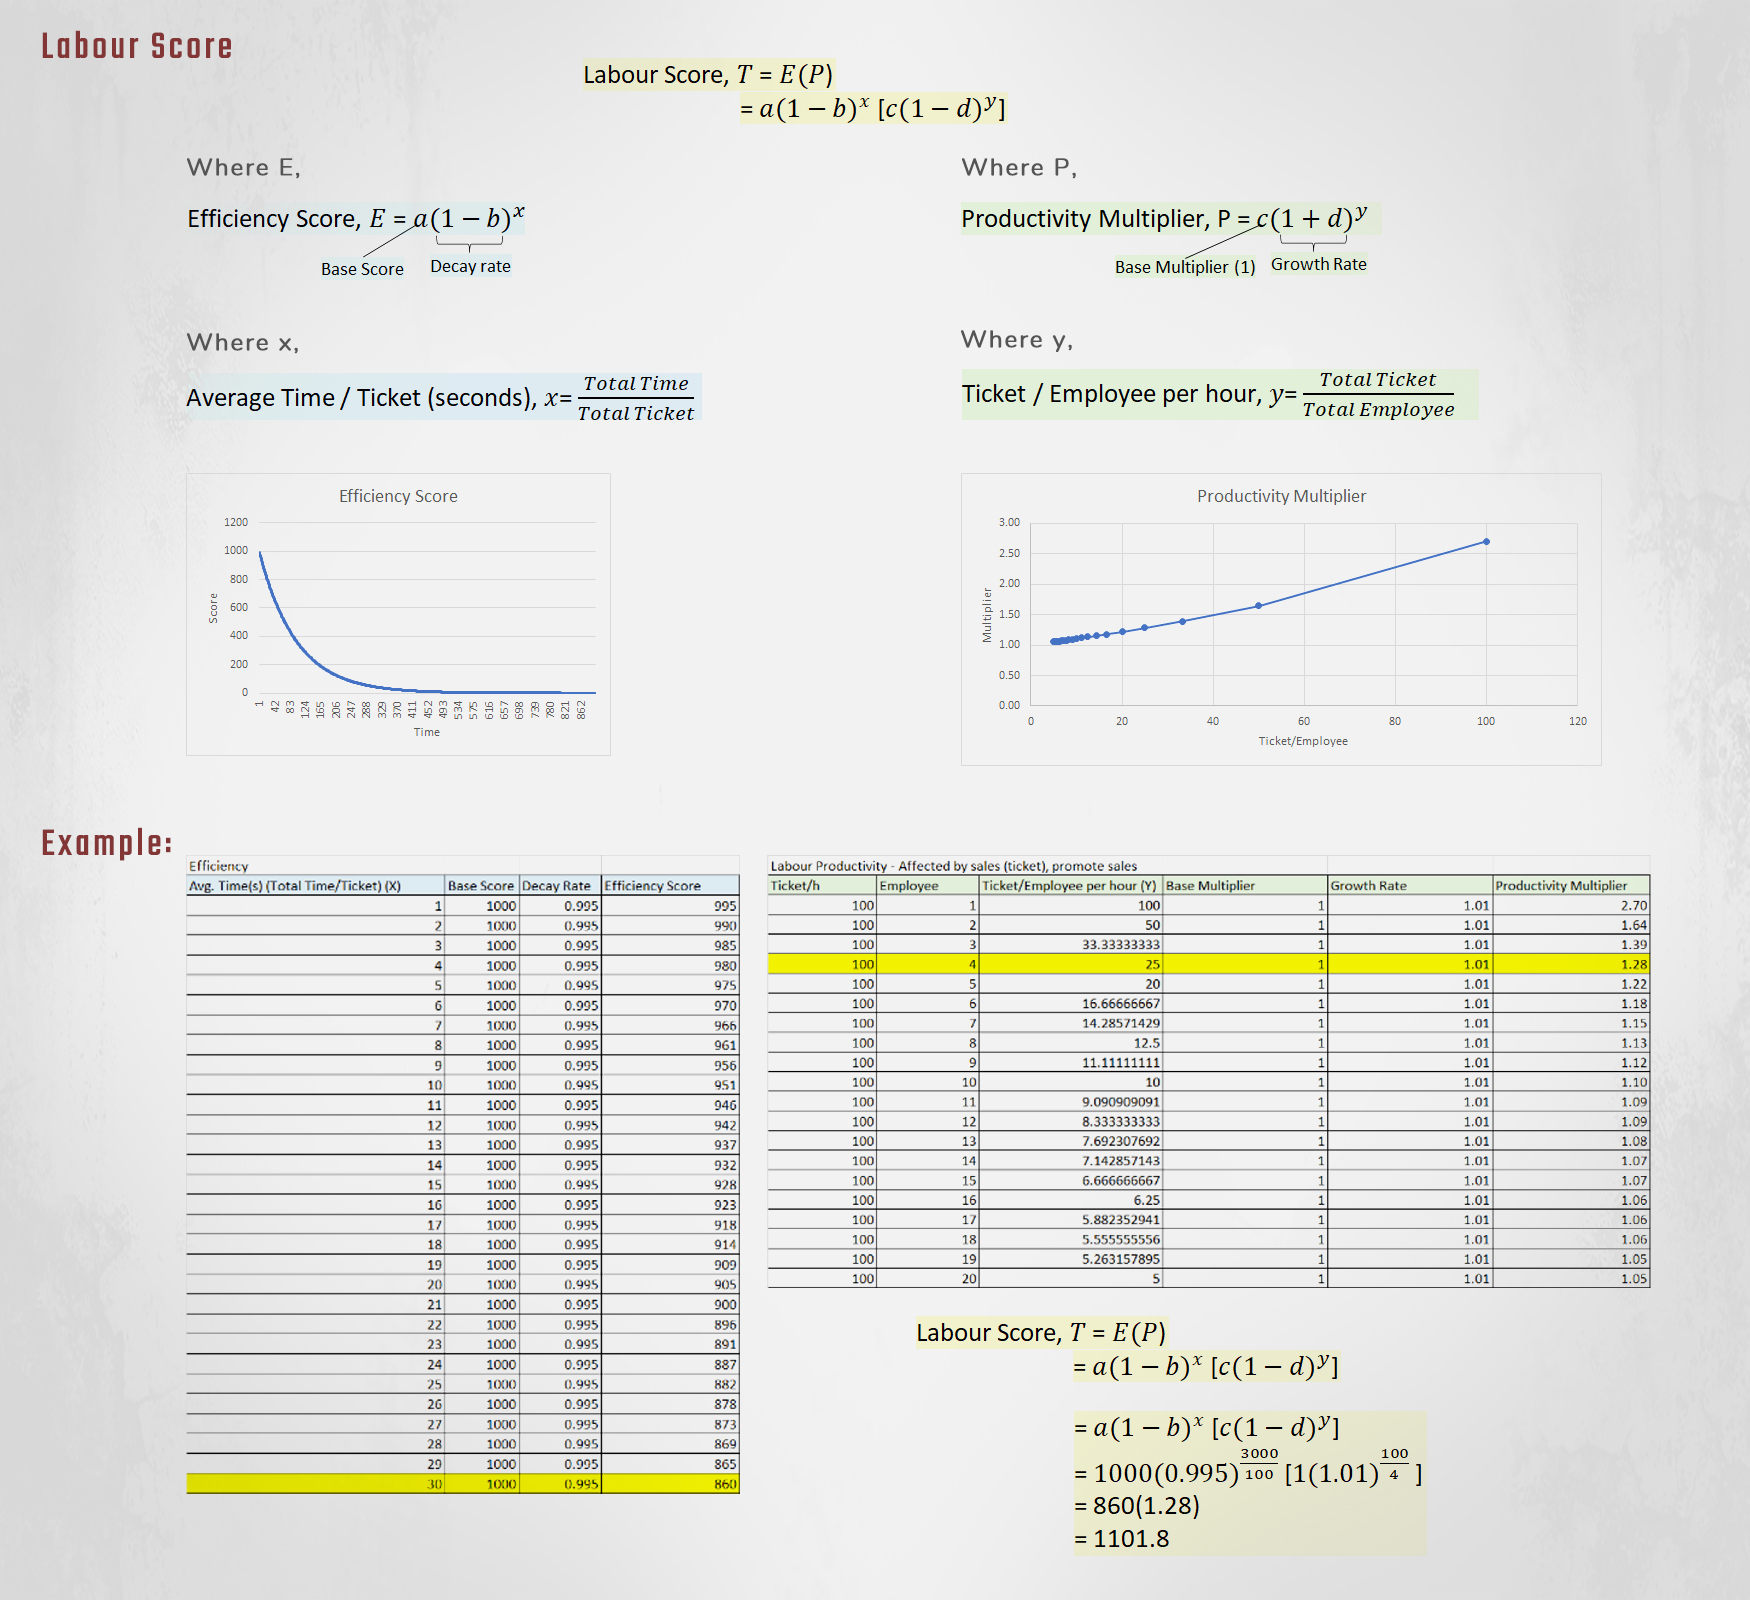
What can the manager do to improve according to this formula?
From the score compared to other managers, they can determine whether their current situation is under perform or well perform, they can adjust their headcount resources or improve their crew’s efficiency and productivity to stay on top of the list.
I run through the meeting with team member and clients via visual presentation slides for iterative changes. There are a lot of interview and survey being carried out at this phase to understand deeper about the users’ work process and the problems they’re facing.
This is because the slight changes with the design calculation might have big impact on the result. As for the salesman part, every criterion accounted for the sales score for the ranking are weighed and calculated accordingly to their feedback on priority.
After drafting out all solution. I categorized the solutions into different groups for users to identify and navigate easily in the wireframe afterwards.
Although we are designing a similar product that are used by tech-savvy businessman, but we still need to design catered to our target user group.
So, we simplified complicated chart and graphs, reduce jargon and convert pretty much all option designed are pre-set.
Our team present the prototype with transitional screens in Adobe XD to the clients and users from time to time during the project timeline for iterative changes to the designs based on their feedback.
The wireframe was prior to usability, it was refined and enhanced before handover to the developers.
Unlike mock project with specific goal and straightforward user test, this web-app has too many things to be tested only by the users when they’re using it or doing their job.
Therefore, a fully functional web-app is needed for testing. Our team planned for the unmoderated remote usability test, we educate the target users about the web-app, prepared the tasks and questions for them during the testing period, scheduled the meetings to gather feedback for analysing result and iterative enhancement.
The feedback includes removing business jargon, cases accounted in the solution, additional settings for some criterion, additional info for business expenses and changes based on user behaviour and familiarity when using the web-app.
One step at a time, do small changes, research, rethink, reiterate, and repeat.
A lot of problems to be solve and strategy ideation cannot be handled overnight, instead, breakdown to parts like solving maths.
It is important to find the suitable solution instead of fastest route that doesn’t solve the underlying problems.
Don’t rely on fancy visual looking data analytics posted out there. Instead, be realistic on what is applicable and useful for the user needs by relying on user interview and research outcome, seek for experienced businessman advice and their take on the research info gathered.
I have to thank my CTO who helped me in developing soft skills. It is important to let the target audience know what you are presenting and simplifying content.
Presenting with the WH question before going to the main point will make the audience understand what content and purpose you are up to, simplifying complicated contents, reduce jargon, assuming the audience are simple-minded.
It is not realistic to test everything you design, find alternative way to validate them such as dogfooding and seek expert advises, make assumptions based on research and data.
Proactively collect data after usability testing to improve the product from time to time.
View Next Project ↓